Hydrometallurgy vs Pyrometallurgy for Precious Metal Recovery
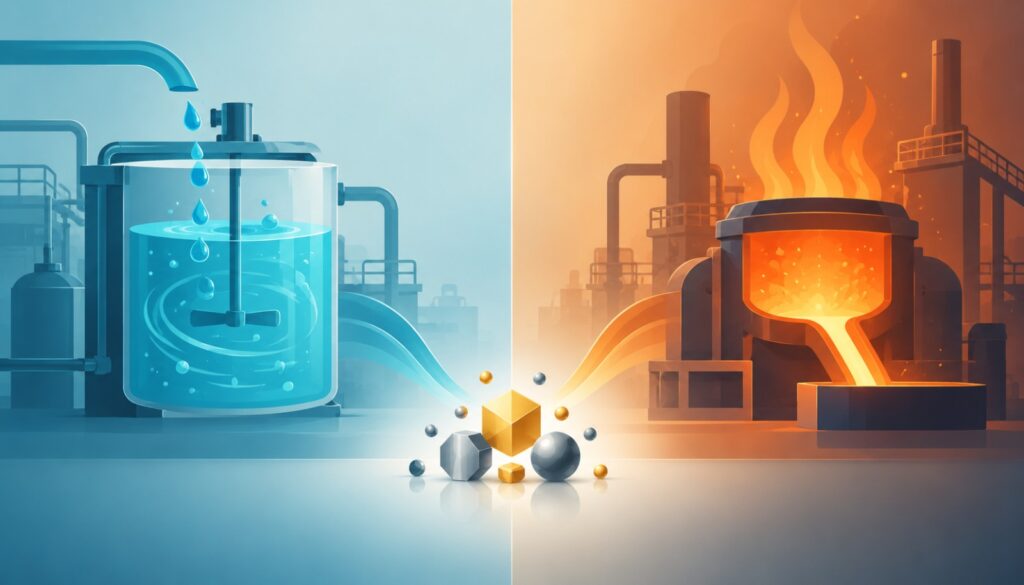
Every discarded circuit board, connector, and chip carries a small amount of gold, silver, palladium, or platinum inside it, and across the volume the world discards each year, that adds up to real money. The world generated a record amount of e-waste in the last reporting year, and only a fraction of it was formally collected and recycled, leaving a significant share of that recoverable value unaccounted for. That gap is exactly why precious metal recovery has become a serious industrial activity rather than a niche one. But having valuable metal in a feedstock is only half the story. How that metal is recovered matters just as much as whether it’s recoverable at all. Two process families dominate the industry: hydrometallurgy, which uses chemical and aqueous methods, and pyrometallurgy, which uses high-temperature thermal treatment. Each has a genuinely different set of strengths, and neither is “better” in the abstract, the right one depends entirely on the material in front of you. This article compares hydrometallurgy vs pyrometallurgy for precious metal recovery in practical terms: how each process works, where each is typically used, how they perform on e-waste specifically, and, critically, when the two are best used together rather than as a choice between one or the other. What Is Hydrometallurgy? Hydrometallurgical precious metal recovery uses chemical solutions rather than heat to extract metals from a feedstock. Material is treated with a leaching agent (common options include cyanide, thiosulfate, aqua regia, or halide-based chemistries) that selectively dissolves target metals into solution. The metal-bearing solution is then processed further through techniques like precipitation, ion exchange, solvent extraction, or electrowinning to separate and concentrate the metal of interest. At a high level, the process runs through three broad stages: Hydrometallurgy is widely used in precious metal recovery methods for gold and silver leaching from ores and scrap, PGM (platinum group metal) separation from spent catalysts, and selective recovery from complex or low-grade material where a more targeted, chemistry-driven approach is needed. Key advantages Key limitations What Is Pyrometallurgy? Pyrometallurgical precious metal recovery uses high-temperature treatment (smelting, roasting, or incineration) to separate metals from a feedstock. Instead of dissolving metals in solution, the process relies on heat to melt, oxidize, or volatilize different components of the material, allowing valuable metals to concentrate into a molten collector phase (often lead, copper, or a similar collector metal) while unwanted material is removed as slag or off-gas. At a high level, thermal treatment typically follows this sequence: Pyrometallurgy is commonly used for complex, mixed feedstocks, particularly e-waste and PCBs, where the material contains multiple metals, plastics, and coatings that would be difficult to process cleanly through chemical leaching alone. It’s also standard for large-scale, continuous operations processing high volumes of material. Key advantages Key limitations Hydrometallurgy vs Pyrometallurgy: Key Differences Both process families ultimately aim to recover the same metals, but they get there through fundamentally different mechanisms, and that difference shows up in almost every practical decision a plant has to make. Factor Hydrometallurgy Pyrometallurgy Process type Chemical / aqueous (leaching, solvent extraction, electrowinning) Thermal (smelting, roasting, incineration) Energy requirements Generally lower Generally high Recovery potential High, when matched to a compatible feedstock High, particularly for complex mixed material Selectivity High, can target specific metals Lower, often needs downstream refining Feed material suited to Lower-grade, complex, or chemically variable feeds Mixed, heterogeneous feeds (e.g. PCBs, e-waste) Processing scale Suits small to mid-scale, modular setups well Better economics at large, continuous scale Capital requirements Moderate High (furnace infrastructure, refractories) Operating costs Driven by reagent/chemical consumption Driven by energy consumption Environmental considerations Wastewater and effluent treatment Emissions and off-gas control Waste generated Spent reagents, treated effluent Slag, flue dust, off-gas residues Best applications Selective recovery, PGM separation, lower-volume operations Complex mixed feedstock, high-volume processing Neither route wins outright. Hydrometallurgy tends to win on selectivity and energy efficiency; pyrometallurgy tends to win on throughput and tolerance for messy, mixed feedstock. The right choice is a function of what’s coming through the gate, not a general preference for one technology over the other. Planning or evaluating a recovery process? Venky Murthy advises businesses on matching the right recovery technology to their specific feedstock and scale. Get in touch to discuss your project → Hydrometallurgy vs Pyrometallurgy for E-Waste E-waste is where this comparison gets genuinely interesting, because it’s rarely a clean, single-metal feedstock. A typical printed circuit board carries gold, silver, palladium, copper, and traces of platinum, all bound up together with plastics, ceramics, and solder, which is exactly the kind of complexity that makes hydrometallurgy vs pyrometallurgy for e-waste a real, material-specific decision rather than a theoretical one. This is one of the clearest illustrations of why precious metal recovery from e-waste so often ends up using both technologies rather than picking one exclusively, a point worth keeping in mind before committing to a single-route plant design. Gold Recovery from E-Waste: Which Method Works Better? Gold tends to be the metal that draws the most attention in e-waste projects, since it typically represents the largest share of recoverable value in PCBs and connectors. For gold recovery from e-waste, both approaches are used commercially, and the better fit depends on the operation: Rather than a single detailed chemical procedure, the practical takeaway is this: gold recovery performance depends less on which method is “better” in isolation and more on how well the chosen method matches the scale and complexity of the e-waste stream feeding it. Which Method Is Better for Precious Metal Recovery? There isn’t a universally better option. The right process depends on how a handful of project-specific variables line up. Hydrometallurgy tends to make more sense when: Pyrometallurgy tends to make more sense when: In practice, this is exactly the kind of decision where a feedstock-first evaluation, rather than a preference for one technology, determines the right answer. It’s also where independent consulting input tends to add the most value, since the “right” process is rarely obvious from equipment brochures alone. Can Hydrometallurgy and Pyrometallurgy Be